WORKS

Wove Multi-Custodian Portal Built With AI Tools

Retooling the product design process with AI tools

Design Operation AI Skills AI Tooling Information Architecture Flow Diagrams Prototype

Statement

The dashboard had to grow from a reporting view into a portal where users manage asset classes, legalities, and lifestyle services across custodians. AI tools were adapted to speed up the process while maintaining human agency.

Contribution

  • Training Claude with skill files about family office operations, entity and ownership, and workflows
  • Formatted PRD as JSON file to be machine readable and ready to be parsed as product specs tickets
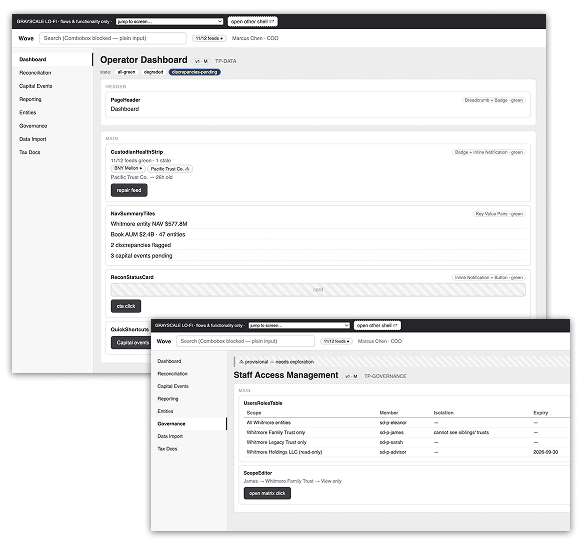
  • Generated Lo-Fi prototype straight from the flow diagram to prepare for the Hi-Fi design in Figma

Results

Feedback loops shortened from weeks to days. Specs parsed for development. Align the single source of truth along development phases and human-AI handoffs.
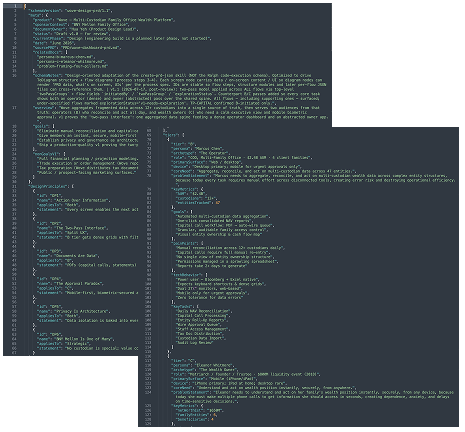
PRD JSON as the single source of truth throughout the process
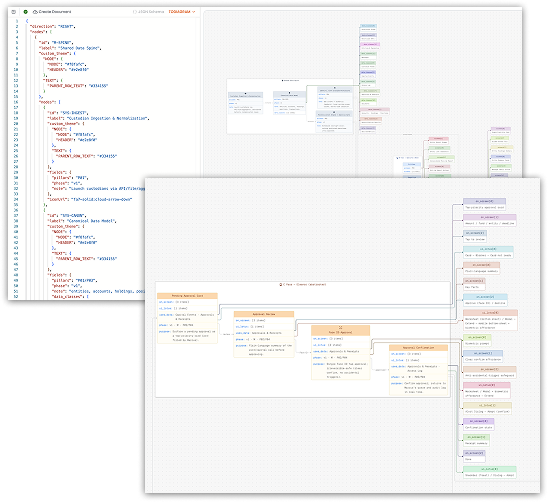
IA and flow diagrams generated from the PRD JSON
Lo-Fi prototype generated straight from the flow diagram

Hamilton Design System — Solutions for All BNY Platforms

Reboot design teams’ workflows through design-to-code parity, scaled across the enterprise and the white-label products

Multi-Tenant Scalability Design Tokens Code Compliance Accessibility Typography Color Palette Responsive Components

Statement

It boosted shipping velocity with design-to-code parity, scaled teams’ capacity with delivery efficiency, and earned client satisfaction and trust with user experience consistency.

Contribution

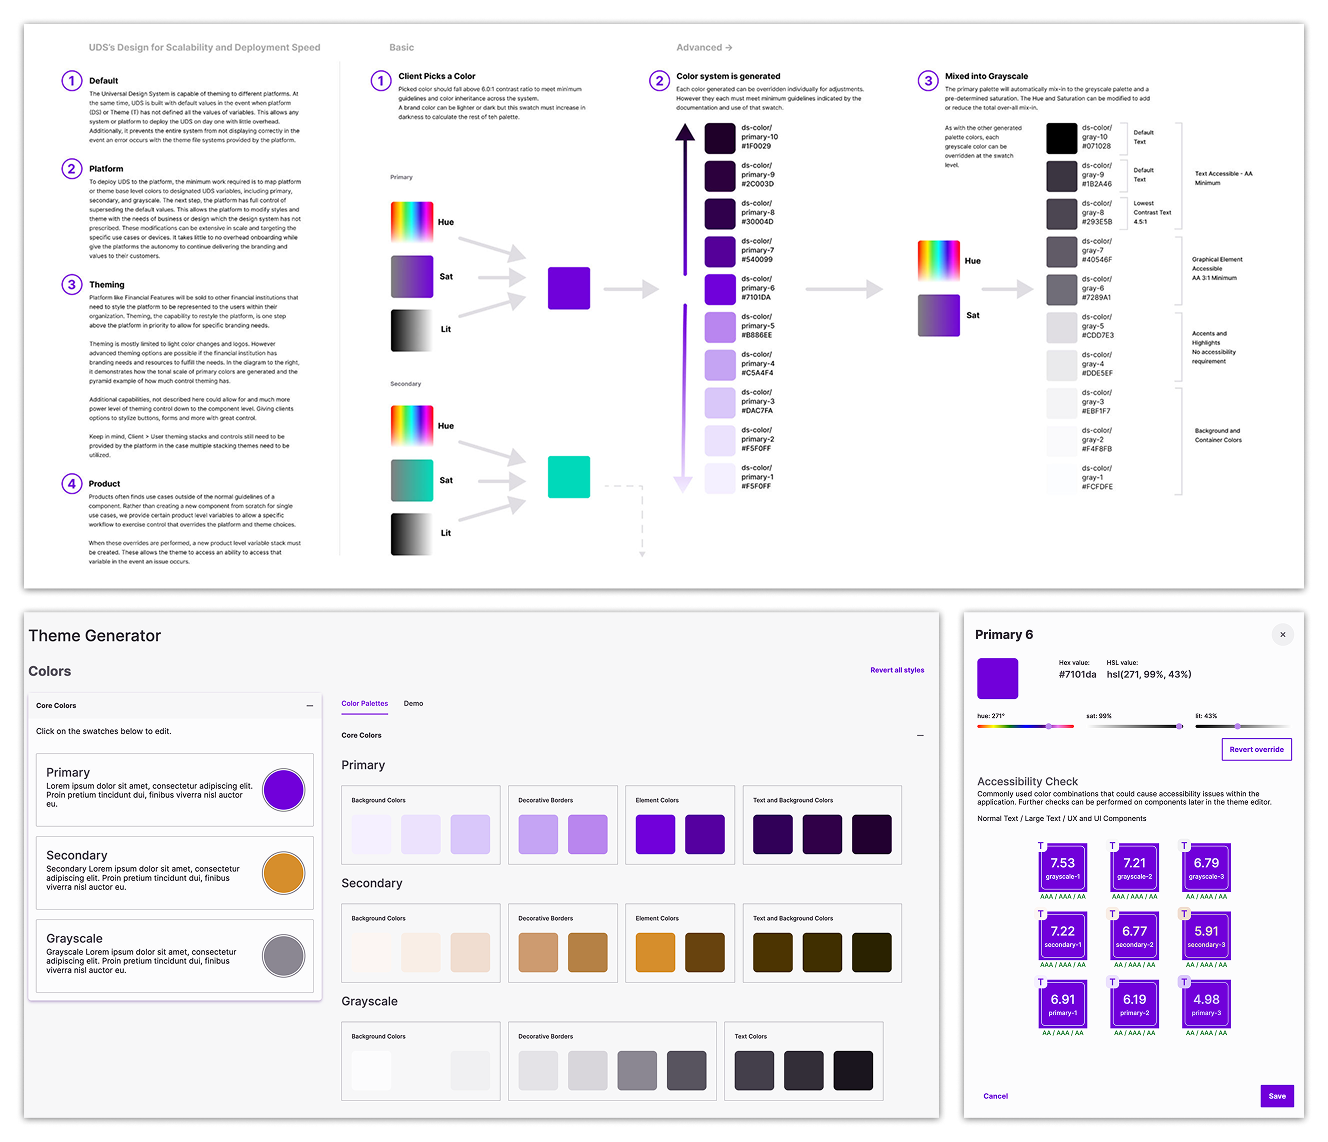
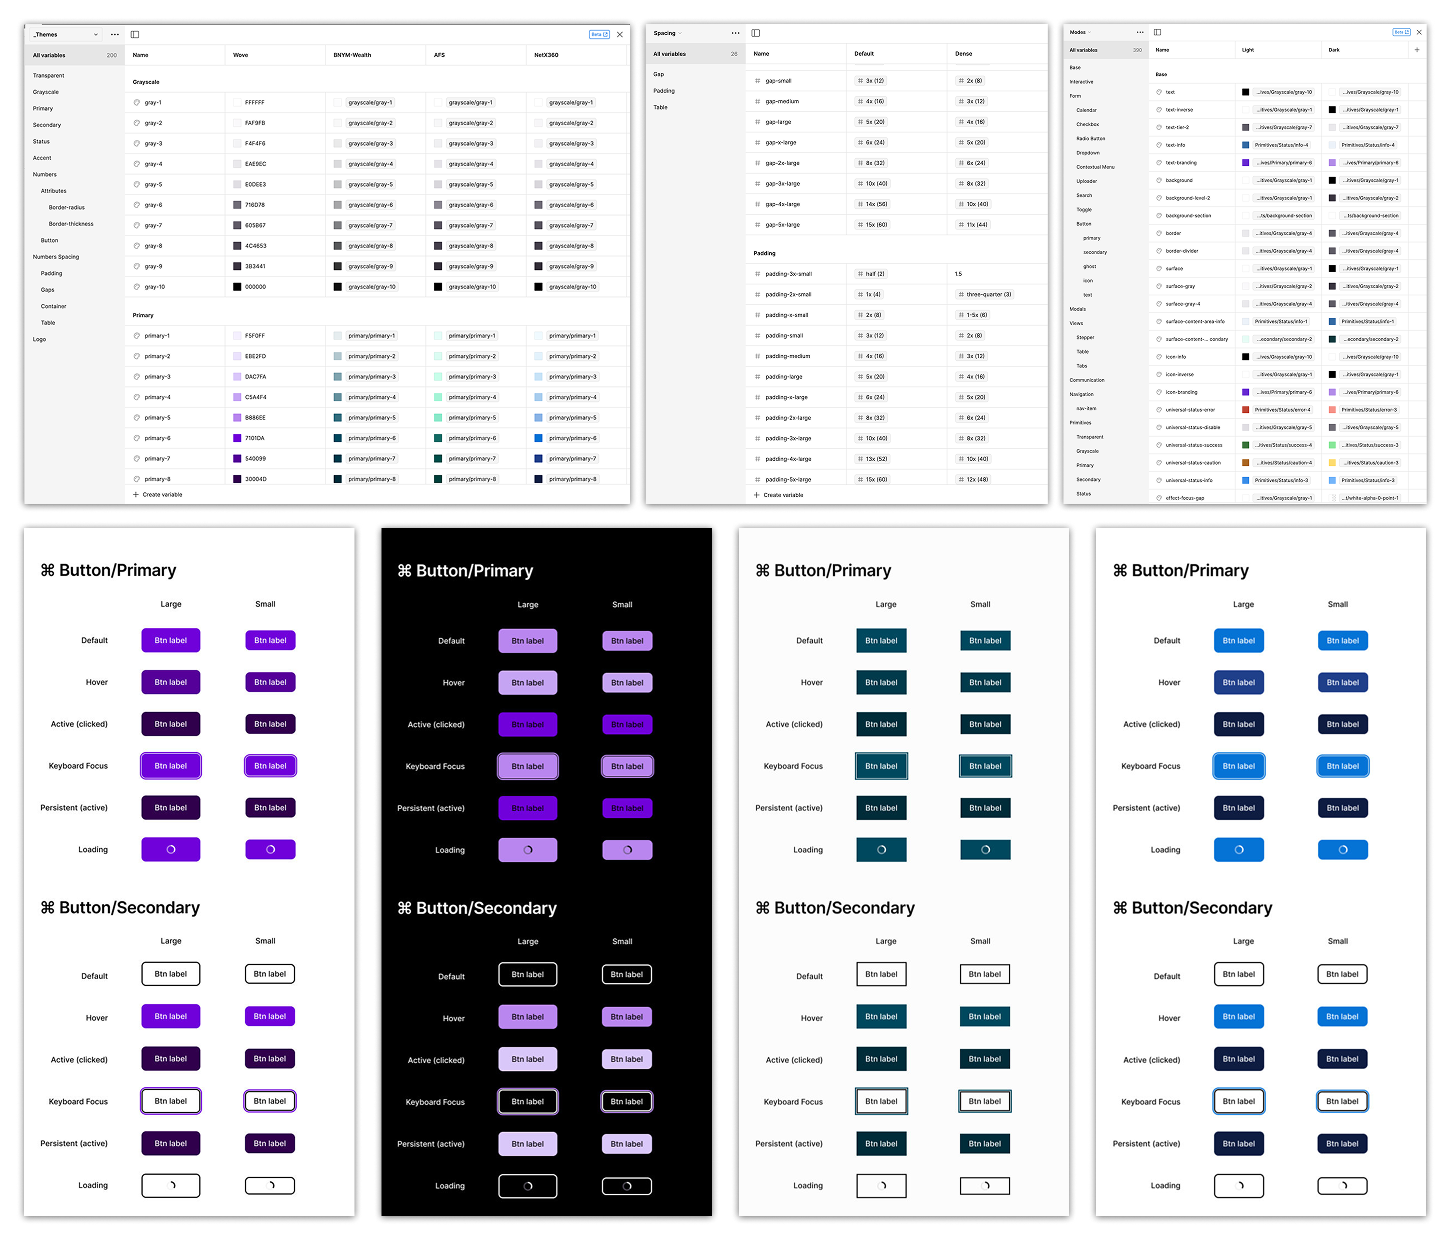
  • Planned and created all design tokens as the foundation of the multi-tenant system that can switch between themes, modes, and spacing
  • Delivered design-to-code parity through collaborating with engineers to assure the consistency and development velocity
  • Defined design patterns and documentations as guidance for designers and as skills for training AI agents

Results

50+ design practitioners supported across 20+ platforms. Shipping velocity up through design-to-code parity, team capacity scaled across products, and client trust earned through the user experience consistency.

Design token foundation and theme generator
Component library across themes and modes
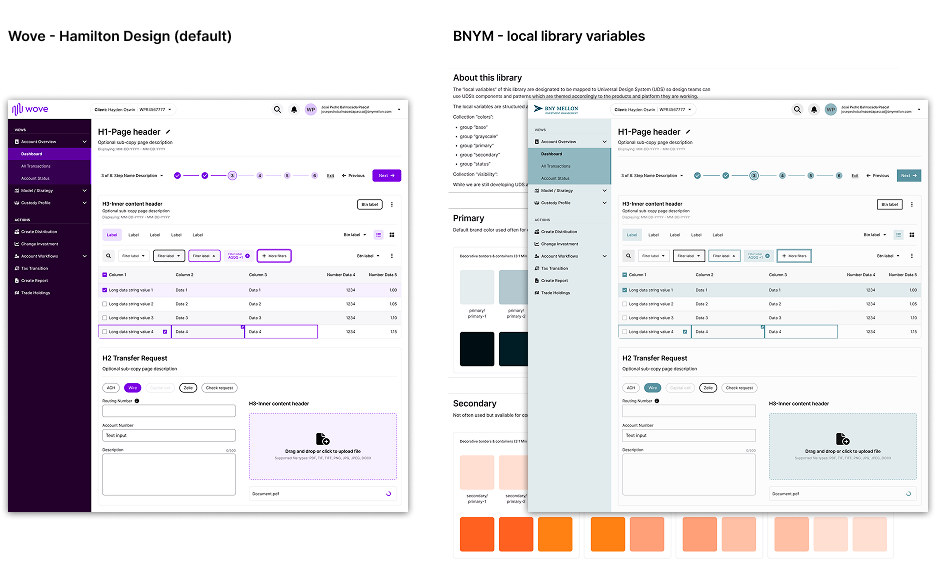
Hamilton Design default and BNYM local library variables

Money Movement Associate Experience

Transform complete transaction lifecycles into a transparent digital experience for associates and clients

Design Brief Cross Function Collaboration Information Architecture User Flow Wireframe UI IX

Statement

Middle- and back-office money movement process was heavily manual and fragmented across legacy applications—the transactions are hard to track and error-prone. Any solution had to satisfy segregation-of-duties and compliance requirements while staying transparent to both clients and advisors.

Contribution

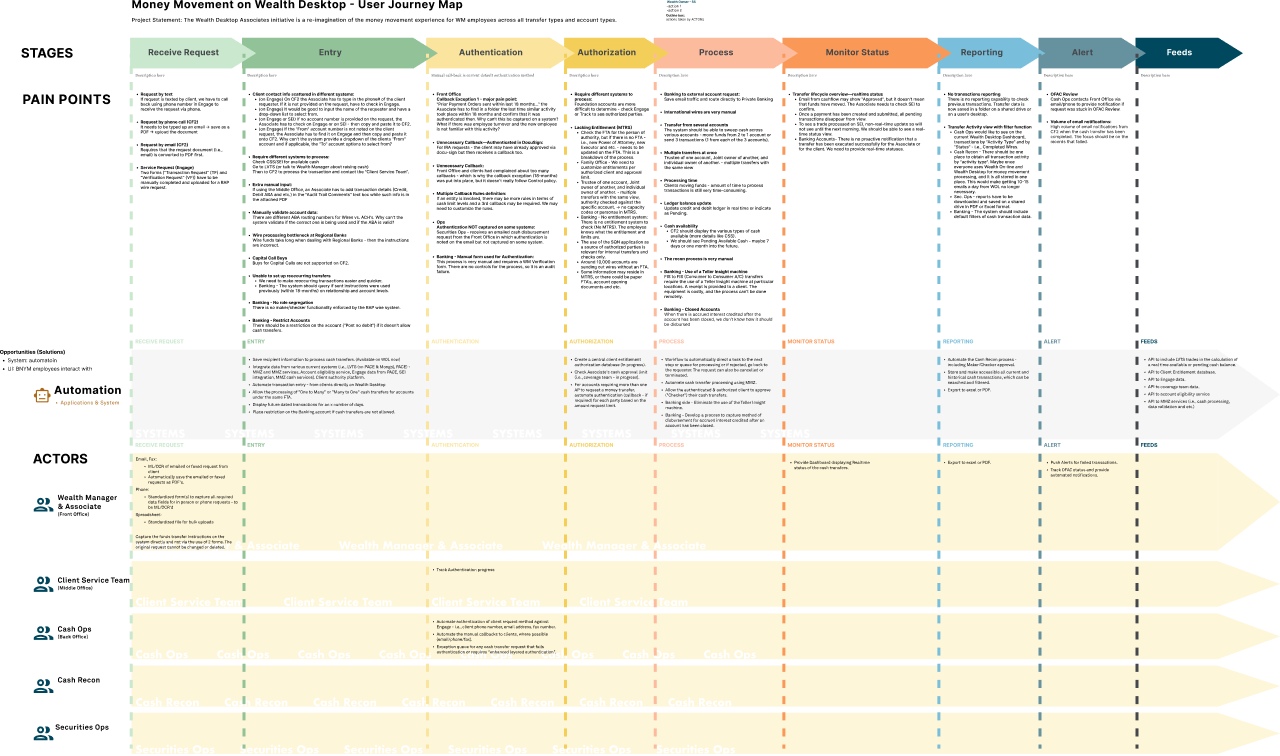
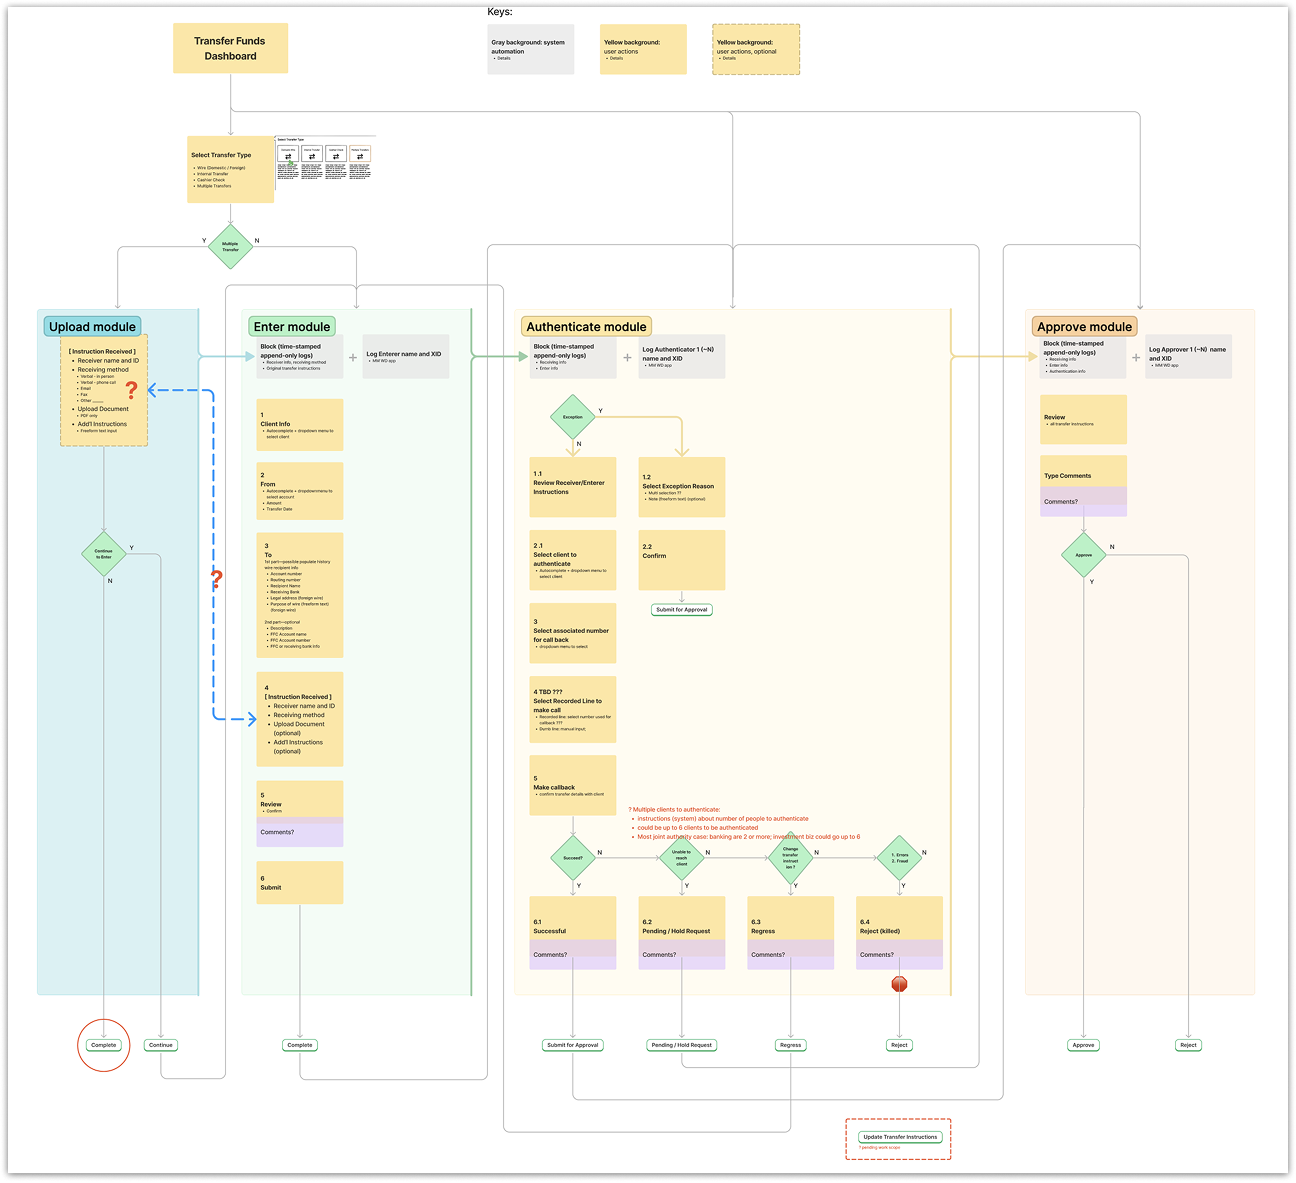
  • Mapped the manual process into a 9-stage transfer lifecycle across 5 persona journey maps spanning front-, middle-, and back-office
  • Aligned the priorities with business and identified dependencies of data stack, APIs, architecture, and resources
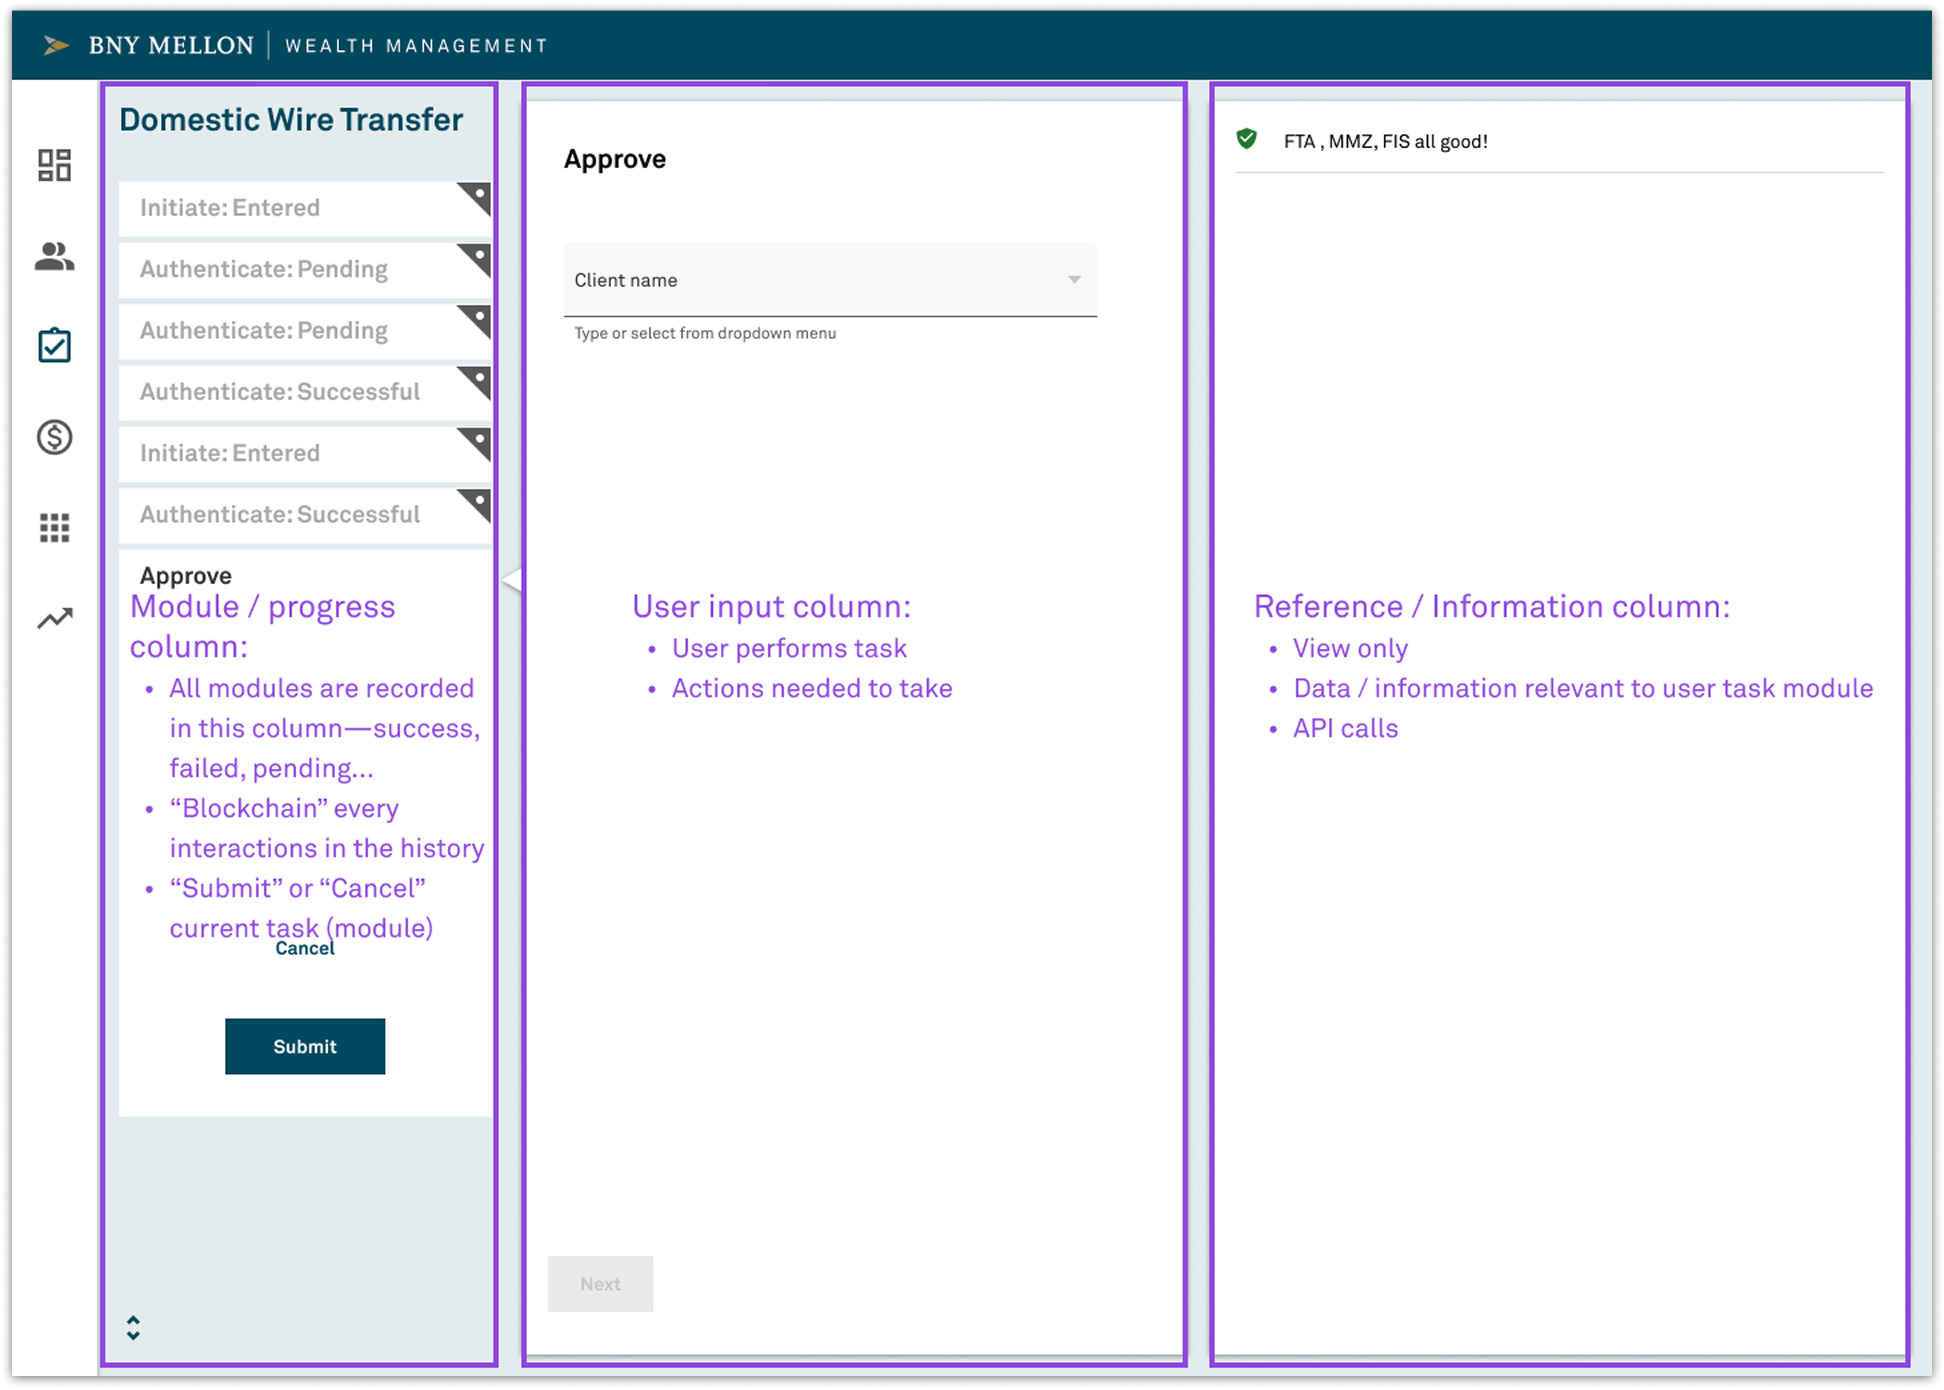
  • Defined each task as reusable modules in transaction lifecycles; each module as three columns for easy navigation, actionable tasks, and reference

Results

Transparent self-service transaction lifecycles for advisors and family office and UHNW clients. A reusable module pattern that made every subsequent transfer type easy to build and easy to use for clients. It builds the confidence on both sides of the transactions.

User journey map across front-, middle- and back-office personas
Nine-stage transfer lifecycle flow
Three-column reusable module pattern in the associate UI

Report Center — Operational Intelligence, One-Click to Custom-Made

One portal to find, run, and build reports across every legacy source in the platform.

Design Brief Data Warehouse Cross Function Alignment Information Architecture User Flow Wireframe IX Layout

Statement

Report Center in Wove is the portal to access reports from different legacy databases and sources—Pershing, e-Analytics, WRI, and custom ones. The project aims to build a new information architecture for all stakeholders to intuitively find templates and create custom reports.

Contribution

  • Distilled and analyzed interviews using in-house AI model Eliza to learn user behaviors and needs to guide information architecture
  • Rendered UML diagrams to align data formats and information hierarchy with engineers to data-warehouse as single source of truth
  • Prioritize work scope and timeline with stakeholders and engineers; roll out functions by phases

Results

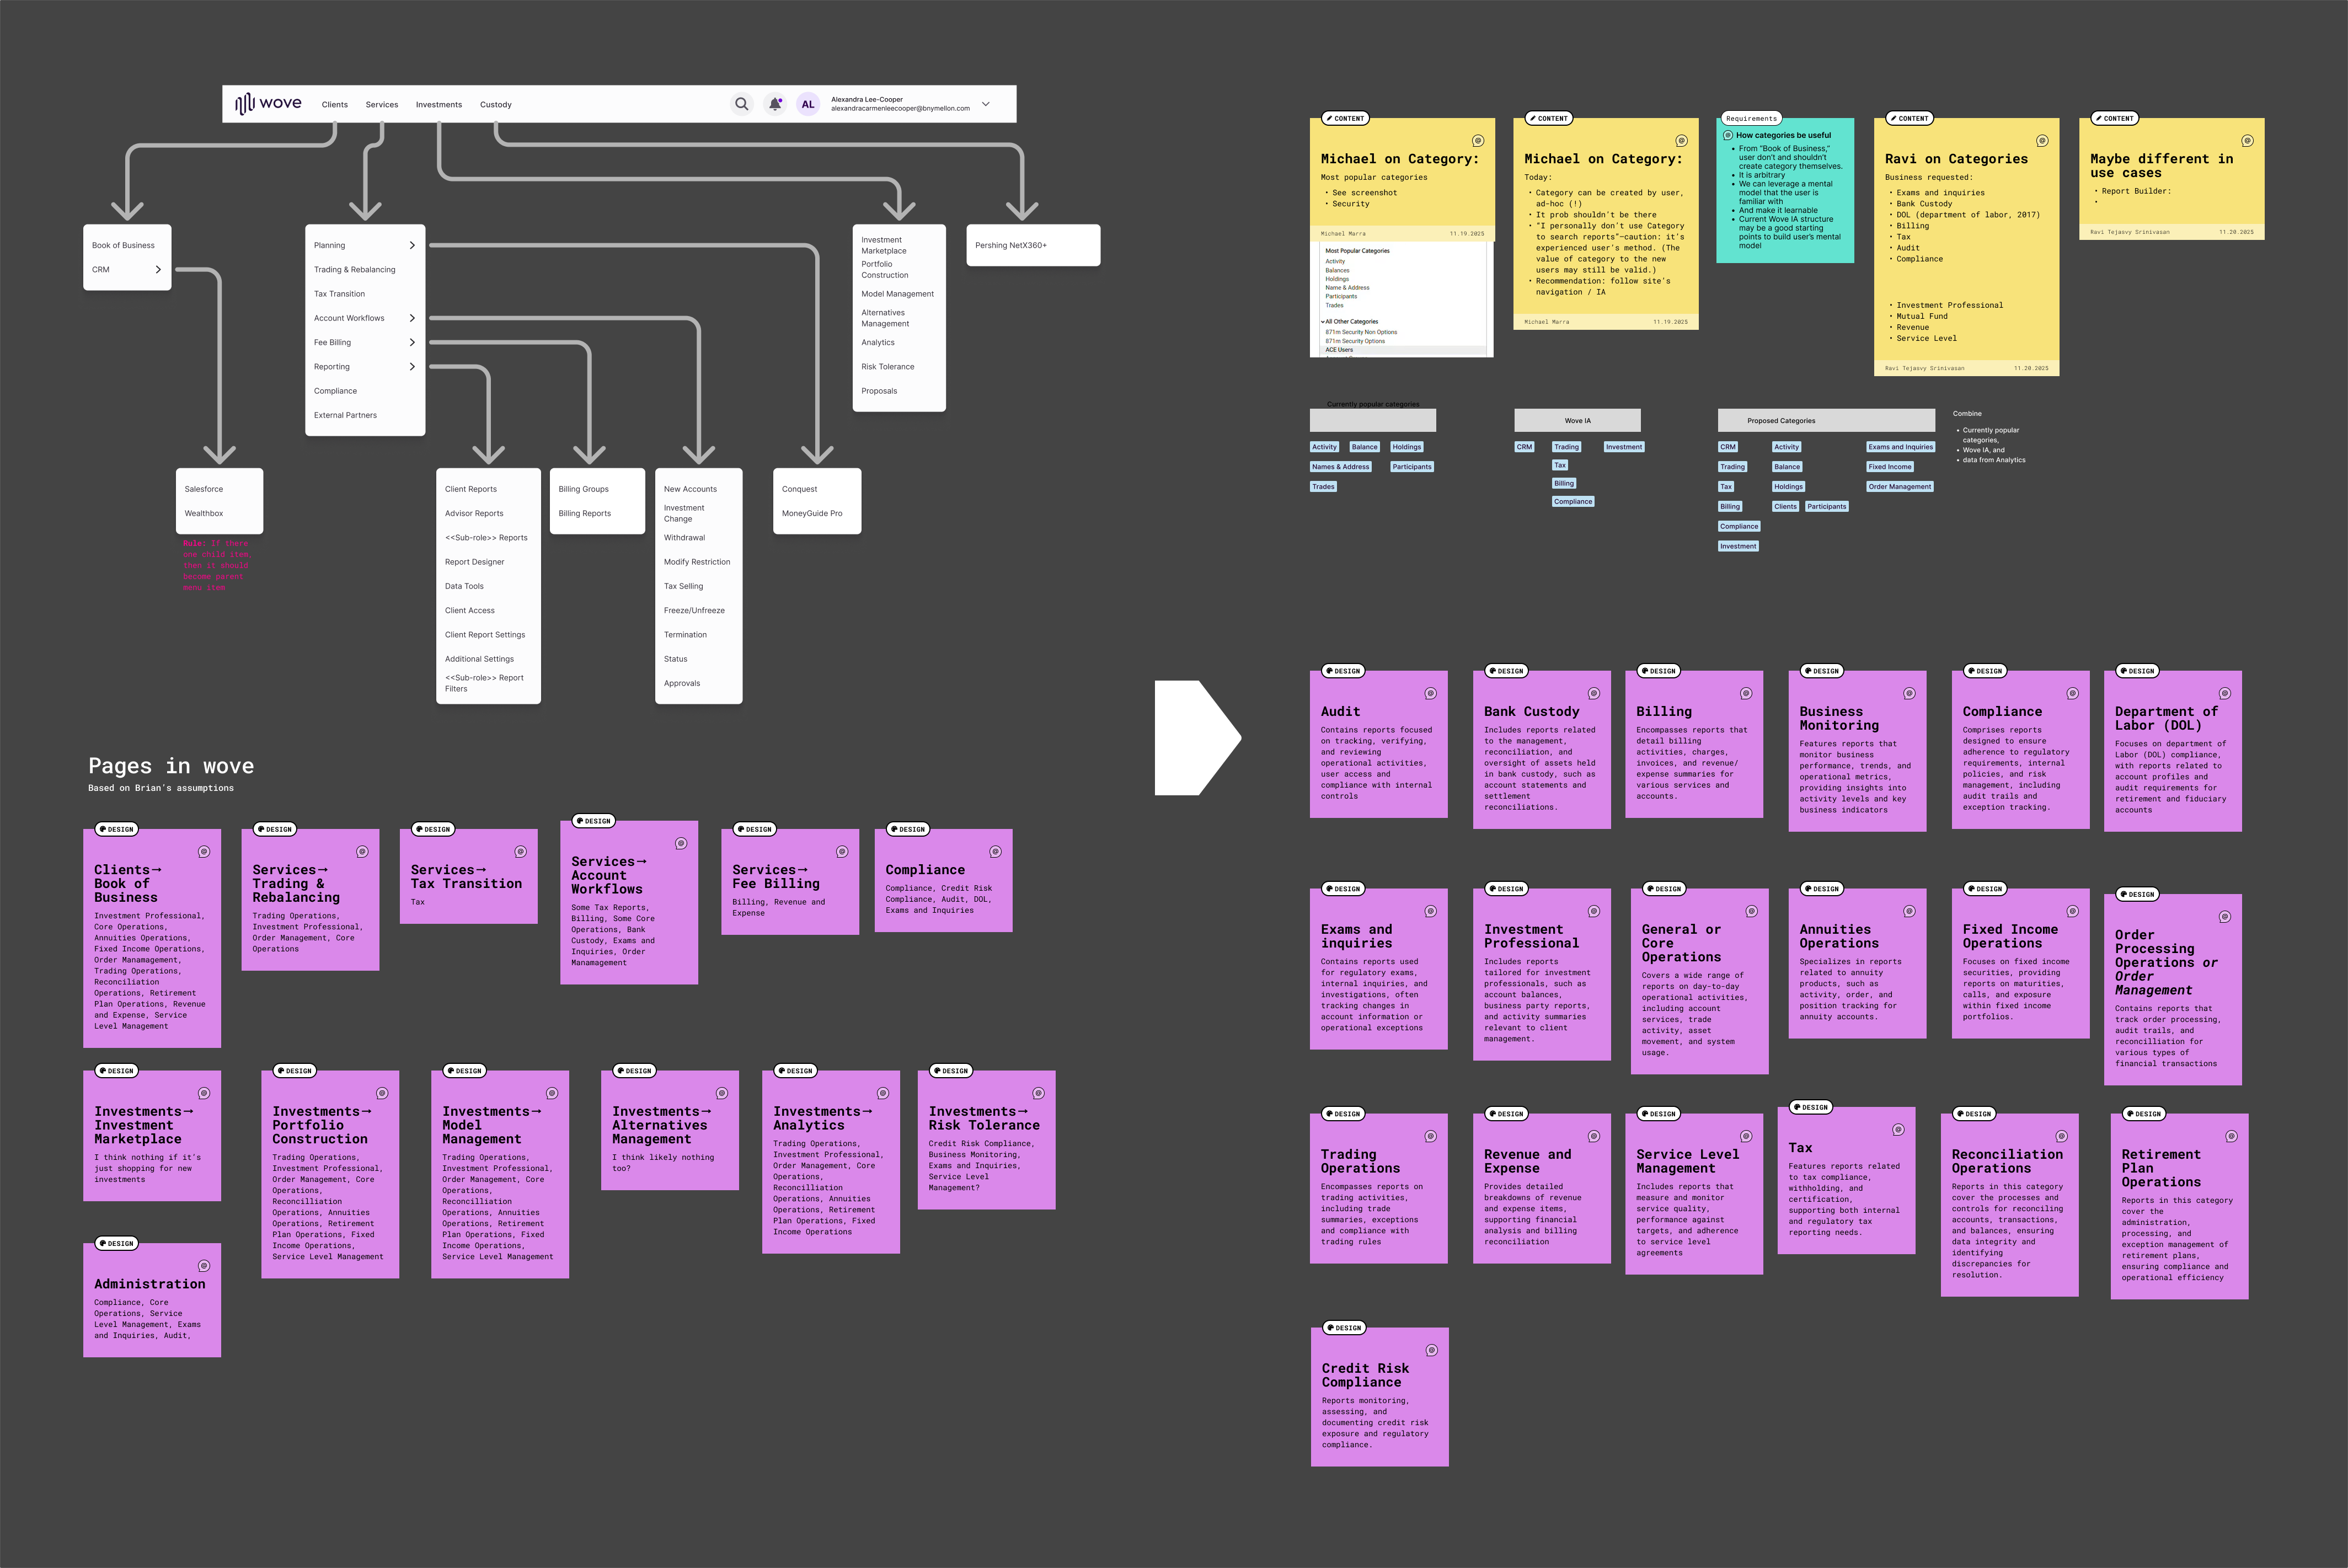
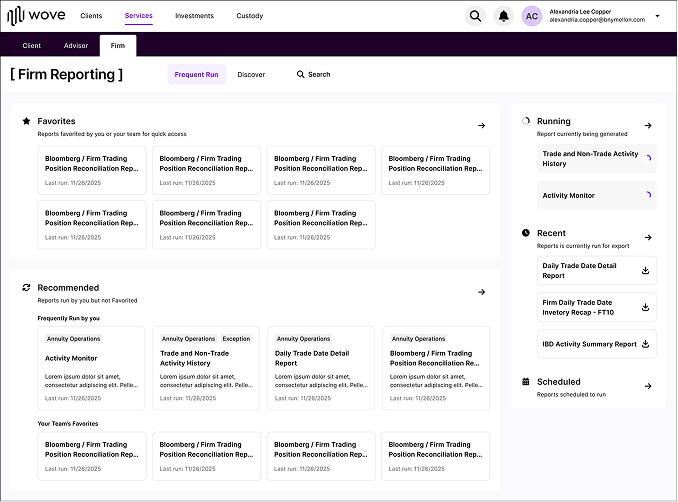
Bifurcated IA is created to work across every legacy source: one findable navigation for returned user and one for custom-made workflow with data granularity needed. Reports are discoverable by category, function, or schedule; and custom report creation is fully self-serviced rather than requested.

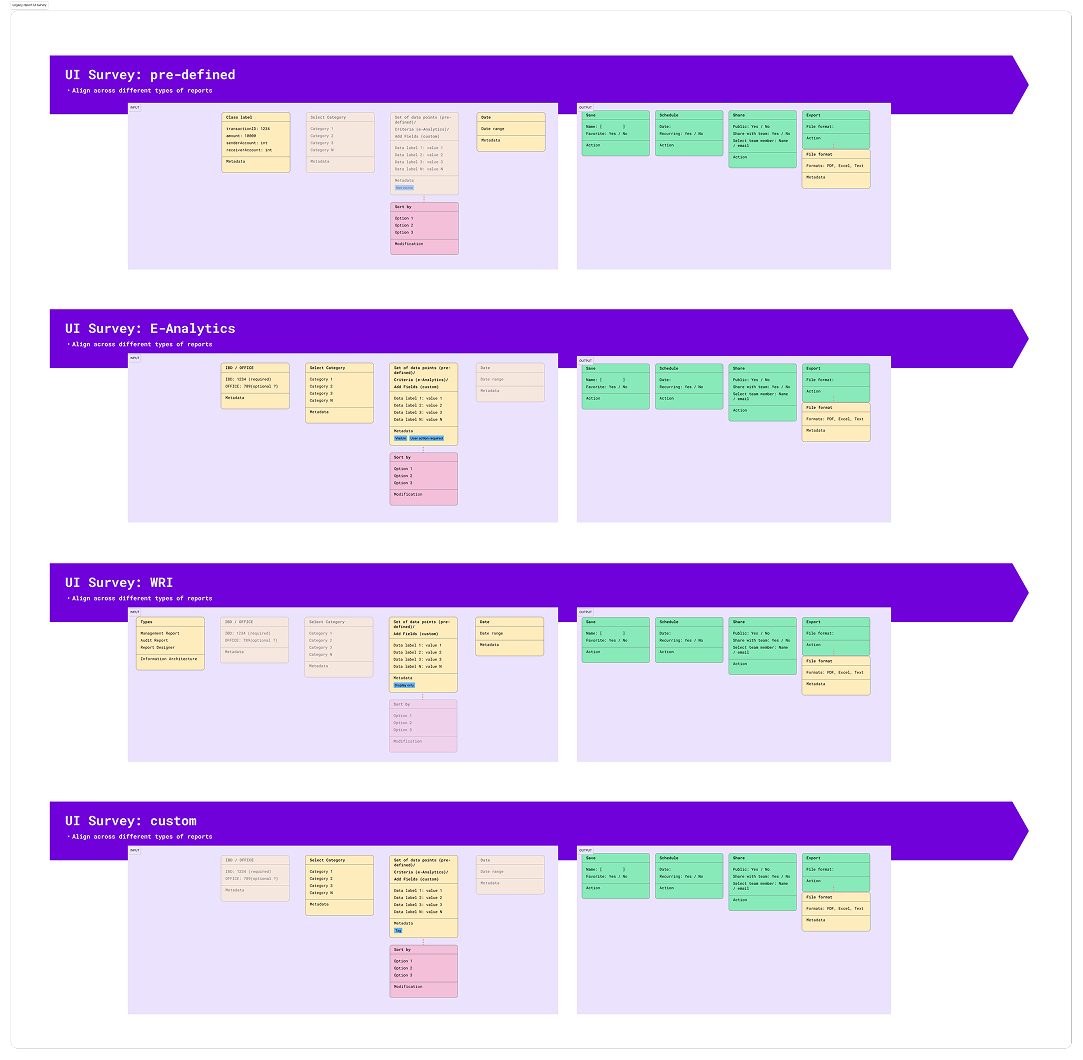
UI survey across pre-defined, e-Analytics, WRI and custom report sources
Information architecture mapped across every legacy source
Firm Reporting portal with favourites, recommended and scheduled reports

Inteplast Building Products — Digital Strategy for a New Consumer Brand

Launch digital marketing portal for the new brand to see brand recognition, top-ranking SERPs, and 207% site visit growth in a year

Branding Digital Strategy Generative Research Content Strategy Information Architecture Wireframe Prototype UI IX

Statement

Launch new building product brand with holistic digital strategy to drive brand awareness and position competitively in premium market. Building the website as the digital portal for brand’s marketing, customer services, and lead generation engine.

Contribution

  • Define digital strategy with generative researches: ethnographic research, interview, intercept survey, customer feedback analysis, and Analytics
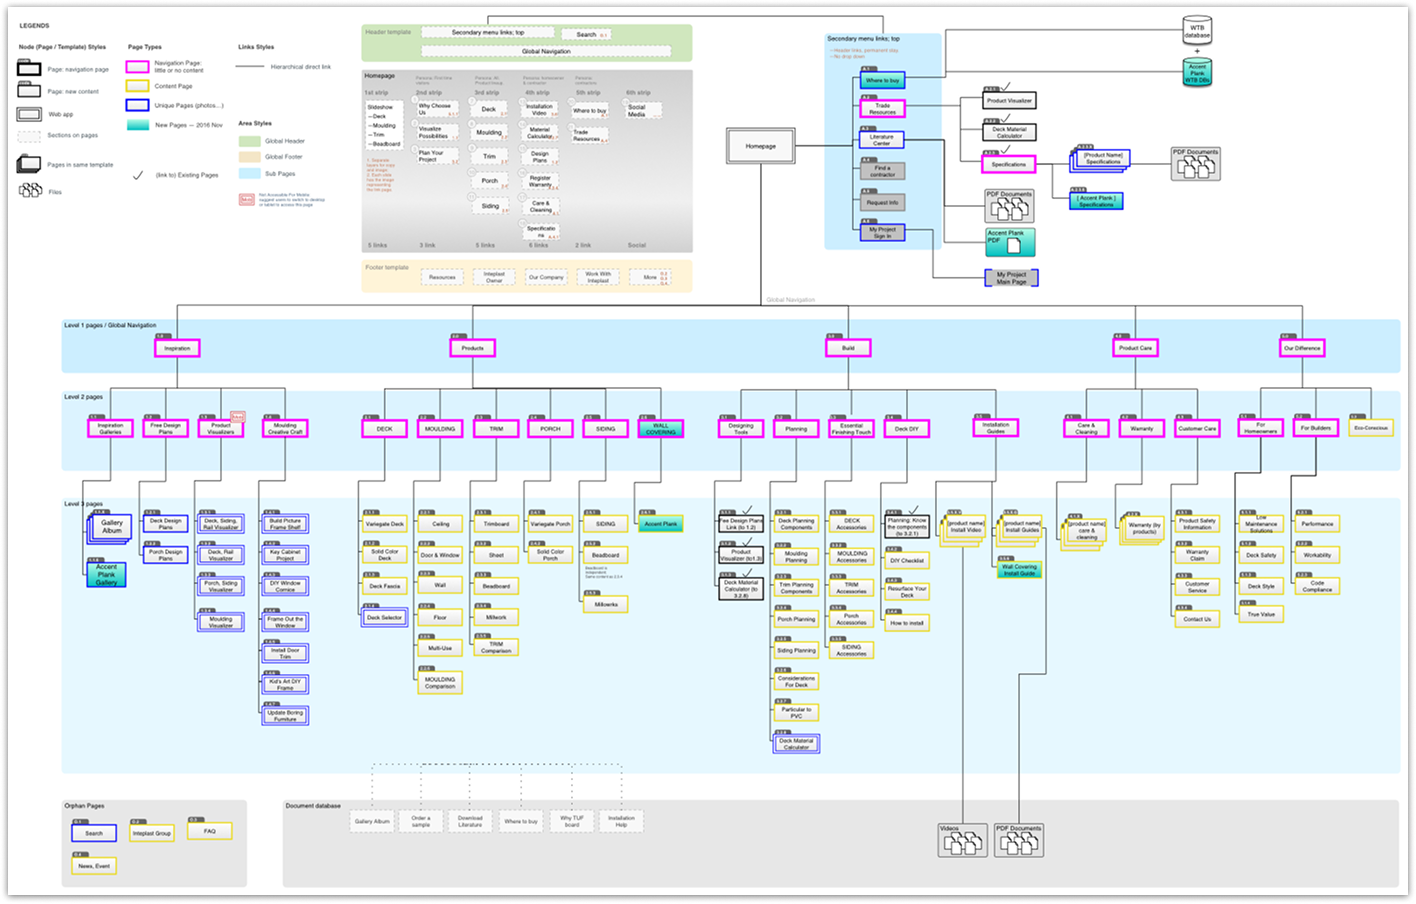
  • Build information architecture and user flows; curate content strategy to convert prospects
  • Design key visuals, style guide, and web apps, responsive design, interaction design, and prototypes for testing

Results

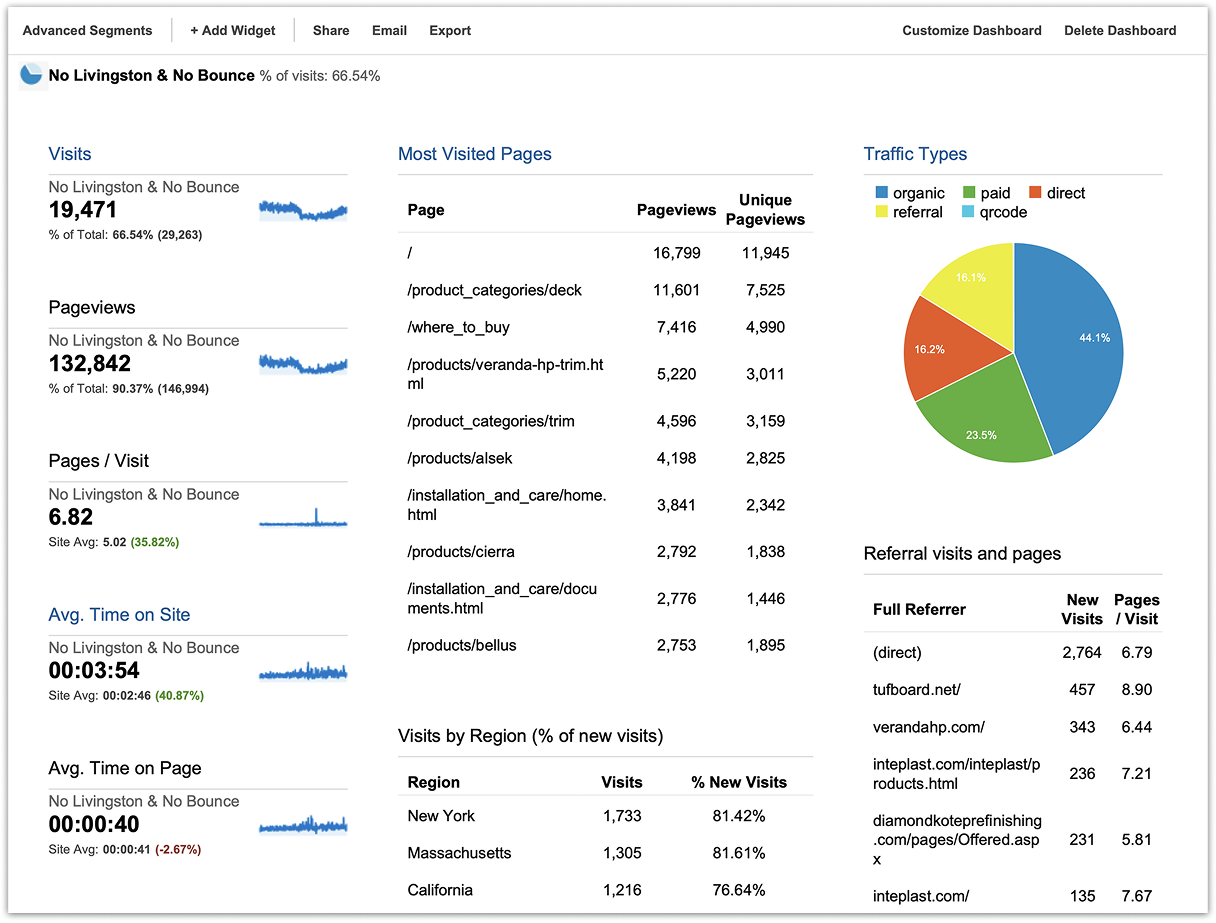
Brand recognition established within a year: 207% site-visit growth (79% organic), 220% growth in unique visitors, 370% conversion growth, the “deck calculator” ranked #1 SERP within six months beating established market leaders, and 35% faster service turnaround from the workflow redesign.

Analytics dashboard showing site visit and referral growth
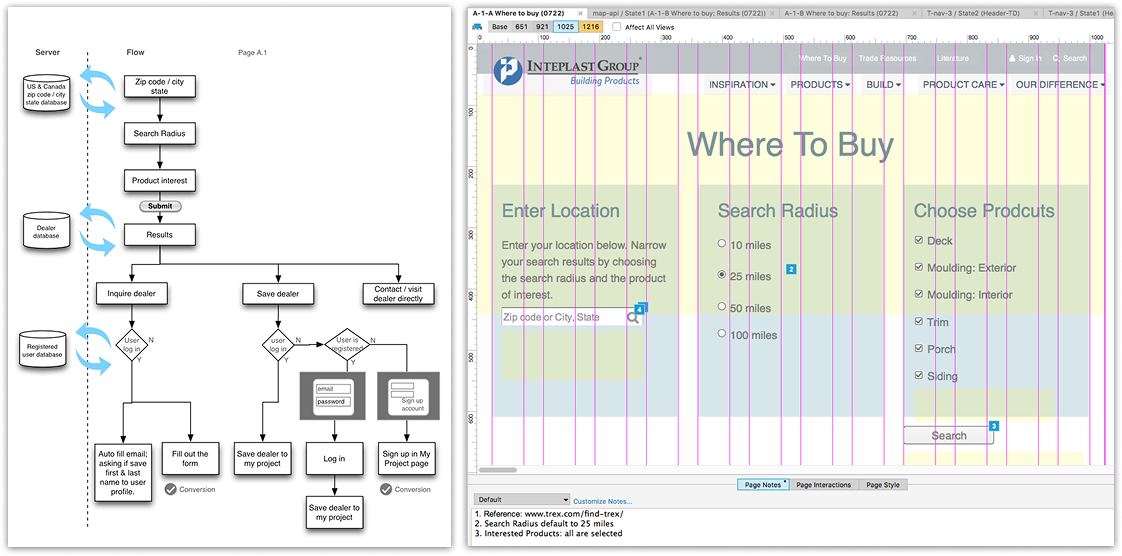
Information architecture and user flows for the marketing portal
Where To Buy locator and product finder prototype

Want the long version?

Want to learn the thinking and details of the showcase of each project? Ask for access, book a time, or a talk with me.

Book a meeting hua@huayeh.com